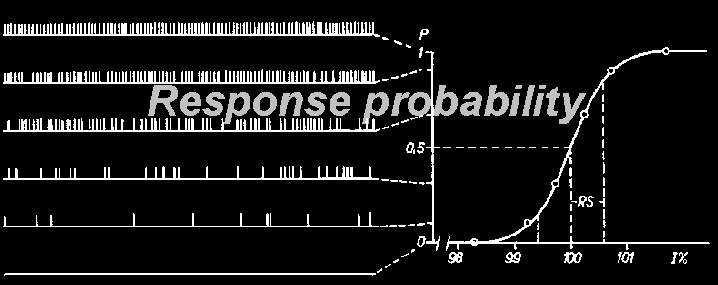
| Electrical
response
series of a nerve fibre to six sets of stimuli each at a different but fixed intensity (I) around threshold ( I% = 100 ). Stimulus frequency: once per two seconds. Threshold intensity is defined by the .5 response probability P. Left: Time series. Right: The probability distribution is Gaussian. The relative spread, RS, is a measure of the width of the probability distribution. Blair and Erlanger described this phenomenon in 1932 and studied it until 1936. Charles Pecher investigated its statistical properties between 1936 and 1939 ( cf. Landahl, 1941. WARNING: THIS PAPER IS HORRIBLY EXPENSIVE) I rediscovered this phenomenon in 1958 and studied it till 1965. |
Elektrische
reacties van een zenuwvezel op per reeks identieke stimuli, uitgedrukt als percentage van de drempel ( I% = 100 ). Stimulus frequentie: één keer per twee seconden. Op de drempel is de reactiekans P gelijk aan 0,5 Links: Tijdreeks. Rechts: De reactiekans volgt de Gauss-verdeling. De relatieve spreiding RS is een maat voor de breedte van de kansverdeling. Dit verschijnsel werd in 1932 door Blair en Erlanger beschreven en tot 1936 door hen bestudeerd. De statistische eigenschappen ervan werden vervolgens door Charles Pecher onderzocht ( 1936 -1939 ) ( zie Landahl, 1941. PAS OP, DIT ARTIKEL IS AFSCHUWELIJK DUUR) In 1958 herontdekte ik deze fluctuaties en bestudeerde ze tot in 1965. |
| Fig. 1 in A.A. Verveen, 1960. On the fluctuation of threshold of the nerve fibre. p. 282-288 in: Structure and function of the cerebral cortex. Amsterdam, Elsevier. (PDF file) |
| |
